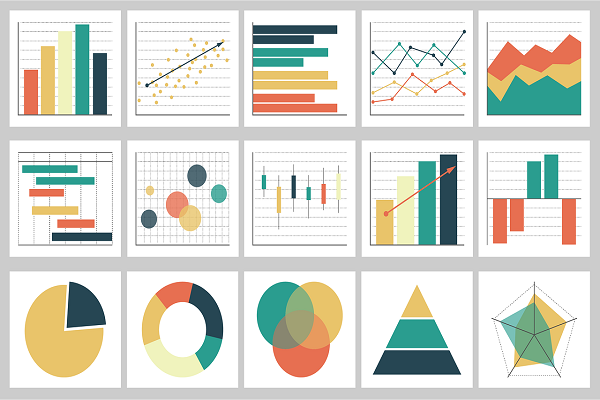
In this age of information overload, the ability to effectively communicate insights derived from data is paramount. Data visualization serves as the bridge between raw data and actionable insights, providing a visually compelling representation of complex information.
This article explores the benefits of data visualization, delves into various types of graphs and charts, and evaluates some of the top tools in the market, weighing their pros and cons.
Benefits of Data Visualization
Clarity and Understanding
- Data visualization simplifies complex datasets, making it easier for both technical and non-technical audiences to understand trends, patterns, and relationships within the data.
Insight Discovery
- Visual representations enable analysts to discover insights and correlations that may be less apparent in raw data. This aids in making informed decisions and identifying areas for improvement.
Effective Communication
- Visualizations provide a powerful means of communication, allowing stakeholders to grasp key messages quickly. Whether in a boardroom presentation or a report, visualizations enhance the impact of data-driven narratives.
Identification of Trends and Anomalies
- Graphs and charts facilitate the identification of trends over time and anomalies in the data. This is crucial for proactive decision-making and anomaly detection in various domains.
Enhanced Decision-Making
- By presenting data visually, decision-makers can absorb information rapidly and make informed choices. Visualizations are particularly valuable when dealing with large datasets or complex scenarios.
Types of Visuaisations
Bar Charts
- Bar charts represent data using rectangular bars of varying lengths. They are effective for comparing discrete categories and showing the distribution of values.
Line Charts
- Line charts display data points connected by lines, illustrating trends over a continuous axis, usually time. They are ideal for visualizing patterns and changes.
Pie Charts
- Pie charts represent parts of a whole, with each segment representing a percentage of the total. They are suitable for displaying proportions and percentages.
Scatter Plots
- Scatter plots depict individual data points on a two-dimensional plane, revealing the relationship between two variables. They are useful for identifying correlations.
Heatmaps
- Heatmaps use color to represent values in a matrix. They are effective for visualizing patterns and relationships in large datasets.
Top Data Visualization Tools
Tableau
Pros:
- User-friendly interface.
- Robust data connectivity and integration.
- Rich set of pre-built visualizations.
Cons:
- High licensing costs for full functionality.
- Steeper learning curve for advanced features.
Microsoft Power BI
Pros:
- Seamless integration with Microsoft products.
- Drag-and-drop functionality for ease of use.
- Robust sharing and collaboration features.
Cons:
- Limited custom visualization options.
- Some features require a deep understanding of DAX (Data Analysis Expressions).
Google Data Studio
Pros:
- Free to use with a Google account.
- Integrates seamlessly with other Google products.
- Collaborative editing and sharing.
Cons:
- Limited data transformation capabilities.
- Less extensive visualization library compared to other tools.
D3.js
Pros:
- Highly customizable and flexible.
- Ideal for creating bespoke visualizations.
- Strong community support.
Cons:
- Requires knowledge of JavaScript and SVG.
- Steeper learning curve compared to drag-and-drop tools.
QlikView/Qlik Sense
Pros:
- Associative data model for efficient data exploration.
- In-memory processing for high performance.
- Robust self-service capabilities.
Cons:
- Licensing costs can be high.
- Limited customization options
Conclusion:
Data visualization is an indispensable tool for unlocking the value of data and driving data-driven decision-making. The choice of visualization types and tools depends on the specific needs of the analysis and the target audience. Whether you opt for the simplicity of drag-and-drop tools like Tableau or the flexibility of D3.js for custom visualizations, the key is to leverage the strengths of each tool to effectively communicate insights. As the field of data visualization continues to evolve, staying informed about the latest tools and best practices ensures that organizations can harness the full potential of their data.
